LineFit
Fitting a straight line to a set of points is one of the classic problems.
There are two programs in NEMO to do this, the original
tablsqfit, and a more
general non-linear fitting program
tabnllsqfit, which
also happens to be able to fit straight lines.
Fitting y=a+bx:
In the the first script a straight line is fitted
to the function y=sqrt(x) on [0,1] for a given number of points
(n=10) and dispersion (sig=0.01). Although this fit will be a bad one,
a little trick can be employed (see scripts for details) to "renormalize"
this chi2 plot to make the minimum 1, such that contours of
2, 5, and 10 would give the error bars for 1, 2 and 3-sigma.
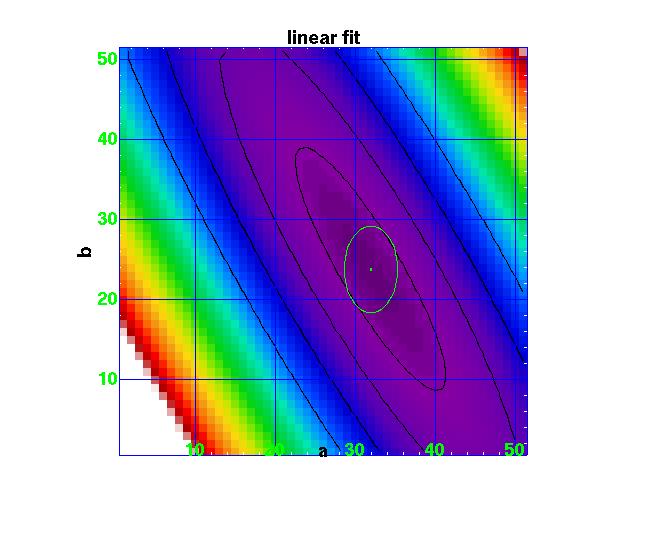
This plot was made with ds9, but unfortunately the axis labeling is in pixels,
not real coordinates. The X axis (a) runs from 0.0 to 0.5 (51 pixels), whereas
the Y axis (b) runs from 0.5 to 1.0 (51 pixels).